.svg) About Us
About Us
 Support
 Contact
Monitor infrastructure before users complain
SNMP and performance alarms feed PikSOC; monitored assets align with Pikenvanter in the same ecosystem.
Monitor servers, network devices, VMs and critical services from one panel. With SNMP and agent-based real-time network monitoring, server monitoring, uptime tracking and performance metrics, catch outages before users do. Built for mid-size and enterprise IT, NOC teams, factories, hospitals and data centres.
Network & system monitoring
SNMP · uptime · SLA
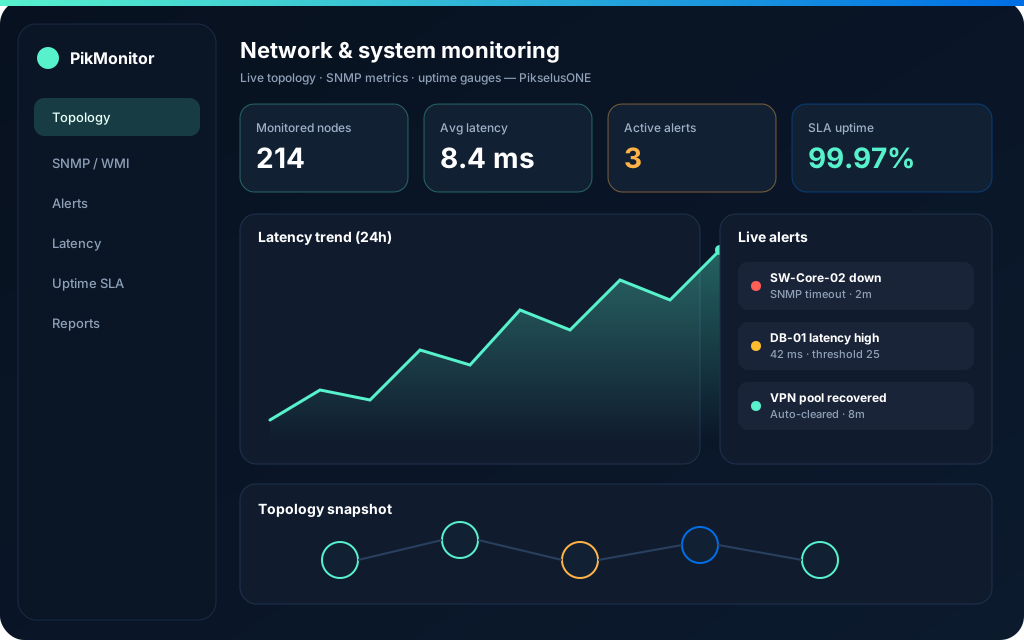
Corporate network and system monitoring in one console. PikMonitor tracks servers, switches, routers, firewalls, virtual machines, storage and application services via SNMP v2/v3, WMI, agents or agentless methods. It collects CPU, memory, disk, bandwidth, packet loss, latency and service availability in real time; threshold breaches trigger email, SMS, webhook or ticket alerts. Uptime and SLA dashboards measure continuity; topology and performance graphs speed root-cause analysis.
Server and network health, uptime, alerts and performance metrics in one view.
SNMP and performance alarms feed PikSOC; monitored assets align with Pikenvanter in the same ecosystem.
SNMP v2/v3, WMI, agents and agentless checks for servers, network gear and services from one centre.
Threshold-based alerts via email, SMS, webhook or helpdesk ticket — shorten MTTR before users report issues.
Measure service continuity against SLA targets with historical uptime and availability reports.
CPU, memory, disk, bandwidth, latency and packet loss trends for proactive capacity planning.
Visualise device relationships and dependency paths to accelerate root-cause analysis during incidents.
Feed infrastructure signals to PikSOC; tie monitored assets to Pikenvanter inventory and Pikhelpdesk incidents.
Replace scattered SNMP, server and uptime tools with end-to-end network monitoring from one panel.
Threshold alerts warn you when services drop or latency spikes — support queues stay clear and MTTR drops.
Built for IT teams, NOC operators and infrastructure managers who need measurable SLA visibility.
Monitoring data feeds PikSOC correlation; assets align with Pikenvanter and incidents with Pikhelpdesk.
Corporate network and system monitoring software for servers, network devices, VMs and services with SNMP, agents, uptime tracking and SLA dashboards.
SNMP v2/v3, WMI, agent-based and agentless methods for servers, switches, firewalls and application services.
Threshold breaches trigger email, SMS, webhook or ticket notifications so teams respond before user impact grows.
Infrastructure alarms and performance signals feed PikSOC for security and operations correlation in one view.
Full control from one screen
Pikenvanter, Pikremote, Pikhelpdesk, PikMDM, PikMonitor, PikPAM, PikSOC, PikBack and Pikselus AI… From IT inventory and remote desktop to mobile device management, network monitoring, privileged access, SIEM/SOC and backup/DR — manage the full PikselusONE product family from one central dashboard instead of jumping between panels. Start with a single module or integrate the full ecosystem for one-stop control.
Share your need — we will get back to you quickly.